A betting dashboard is defined as a centralized tool that aggregates your sports betting data in real time, displaying wagers, bankroll status, and performance metrics like ROI and CLV in one organized view. If you have ever lost track of a bet, misjudged your bankroll, or repeated a losing strategy without realizing it, a betting dashboard solves all three problems at once. Industry guidance as of 2026 positions these dashboards as direct replacements for manual spreadsheets, with automated syncing across multiple sportsbooks making setup faster than ever. Platforms like Goldbet888 pair live odds with the kind of real-time data environment where dashboard tracking delivers its full value.
What is a betting dashboard and why does it matter?
A betting dashboard is your analytical command center. It aggregates data across sportsbooks, giving you a live view of every open wager, your current bankroll, and critical performance metrics all in one place. That single view replaces the guesswork that causes most bettors to repeat costly mistakes.
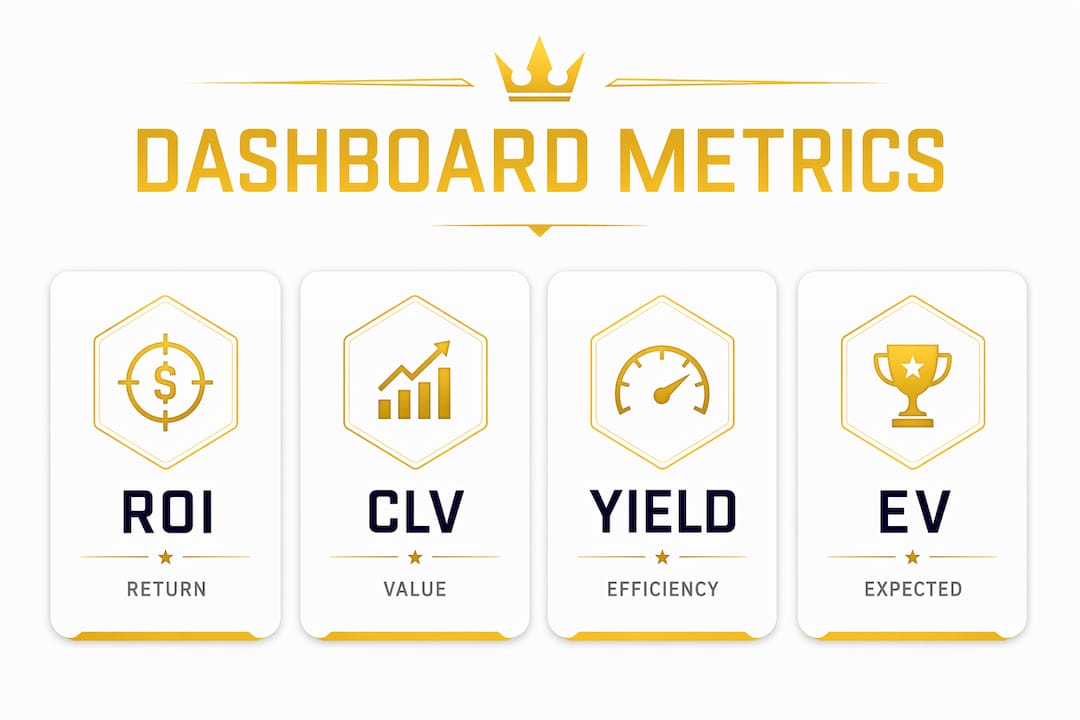
The metrics that matter most on any dashboard are ROI, yield, closing line value (CLV), and expected value (EV). ROI and CLV are more reliable profitability indicators than win rate alone. Win rate can look healthy while your bankroll quietly erodes through poor staking decisions.

Dashboards also embed responsible gambling controls directly into the interface. Bankroll exposure limits, deposit alerts, and session timers are standard features on professional-grade platforms. These controls turn the dashboard from a simple ledger into a tool that actively protects your capital.
What are the essential features and metrics of a betting dashboard?
The most effective dashboards share a consistent set of core features. Knowing what to look for saves you from choosing a tool that looks impressive but delivers little analytical depth.
Core features to look for:
- Real-time bet tracking: Every wager updates instantly, so your bankroll figure is always accurate.
- Bankroll overview: A running balance with exposure visualization shows how much capital is at risk at any moment.
- Betting history log: A searchable record of past bets, filterable by sport, league, bet type, and date range.
- Performance metrics panel: Displays ROI, yield, CLV, EV, and win rate in one readable summary.
- Market alerts: Flags positive expected value (+EV) opportunities before lines move.
- Responsible gambling controls: Deposit limits, loss thresholds, and session timers built into the interface.
Bettors should track 3–5 essential metrics rather than monitoring every data point the dashboard offers. Tracking too many figures at once creates noise that obscures the signals worth acting on. Start with ROI, CLV, and yield, then add EV and win rate once you are comfortable interpreting the first three.
Filtering capability is what separates a useful dashboard from a basic one. The ability to isolate performance by sport, league, or bet type reveals which markets are genuinely profitable for you and which are draining your bankroll without you noticing.
Pro Tip: Set your dashboard to display CLV alongside win rate every week. If your CLV is consistently positive but your win rate looks low, you are beating the market and variance is the issue, not your strategy.
How do bettors input data and sync sportsbook accounts?
Data gets into a dashboard through two methods: automatic syncing and manual logging. Each has a distinct role, and the best bettors use both.
Automatic syncing connects your sportsbook account directly to the dashboard. Syncing typically takes under 2 minutes to authorize and immediately pulls your full bet history. Most professional dashboards support 10 or more sportsbooks. The benefit is speed and completeness. The risk is that sync errors occasionally miss bets or duplicate entries, which distorts your performance data if left unchecked.
Manual logging gives you granular control. For sportsbooks that do not support automatic syncing, or for bets placed through a community tip channel, manual entry is the only option. Manual logging also lets you add tags that automatic syncing cannot generate, such as the strategy behind a bet or the prediction source you followed.
Here is how the two tiers of dashboard access compare:
- Free tier: Covers basic bet logging, bankroll tracking, and simple win-loss records. Sufficient for casual bettors starting out.
- Paid tier: Unlocks advanced analytics, CLV tracking, AI-assisted trend analysis, and multi-sportsbook syncing. Advanced features start around $18–$25 per month on most platforms.
Consistent and detailed bet tagging by type and league is what makes the difference between a dashboard that shows you numbers and one that shows you patterns. Without tags, you cannot tell whether your losses come from Asian Handicap bets specifically or from a single underperforming league.
Pro Tip: After each sync, spot-check five recent bets against your sportsbook account history. Catching one sync error early prevents weeks of misleading data from building up.
Why does a betting dashboard outperform manual tracking?
Manual tracking in a spreadsheet records what happened. A betting dashboard reveals why it happened and what to do next. That distinction is the core advantage.
The primary cause of bettor failure is relying on gut feelings rather than objective performance data. A dashboard removes that bias by surfacing patterns you would never spot manually, such as consistent losses on midweek fixtures or a negative ROI on Over/Under bets despite a strong win rate on Asian Handicap markets.
Four specific advantages set dashboards apart from spreadsheets:
- Performance leak detection. The dashboard flags which leagues, bet types, or time periods are consistently unprofitable. You stop chasing losses in markets that have never worked for you.
- Bankroll discipline. Exposure visualization shows exactly how much capital is tied up in open bets. You avoid overextending on a single match or tournament.
- Trend identification. Dashboards track performance across hundreds of bets, revealing edges that only appear at scale. A gut feeling cannot process that volume.
- Strategy validation. Experienced bettors schedule weekly reviews comparing AI predictions and actual outcomes. This confirms whether a strategy is working or just running on short-term variance.
“The edge in betting belongs to those who analyze objective data patterns, not those relying on intuition. Dashboards help spot hidden losses and optimize strategy.”
A dashboard is a decision-support system, not just a record keeper. When you use it that way, it changes how you allocate capital, which markets you enter, and how quickly you cut losing strategies. Read match analysis before placing bets to combine external research with your dashboard’s internal performance data for the strongest possible decision framework.
How can beginners start using a betting dashboard without getting overwhelmed?
New bettors often make the same mistake: they open a dashboard, see 15 panels and 30 metrics, and either ignore most of it or try to use everything at once. Neither approach works.
Mastering the overview panel first is the correct starting point. The overview panel displays your current balance, open bets, and recent transaction history. Those three data points tell you everything you need to know in the first week of use. Advanced analytics mean nothing if you do not yet have a baseline of clean, tagged data to analyze.
A practical beginner roadmap looks like this:
- Week 1: Log every bet, tag it by sport and bet type, and check the overview panel daily.
- Week 2: Explore the betting history filter. Sort by sport and compare win rates across markets.
- Week 3: Add CLV and ROI to your weekly review. Note which markets show positive CLV consistently.
- Week 4: Set a bankroll exposure limit and activate any responsible gambling controls the dashboard offers.
- Month 2 onward: Schedule a weekly 20-minute review session. Compare your dashboard data against any external predictions or community tips you follow.
Tagging bets properly from day one is the single most important habit a beginner can build. Without granular data input, the dashboard cannot identify which strategies or markets are genuinely profitable. A bet logged as “football” is far less useful than one tagged as “Singapore Premier League, Asian Handicap, -0.5, following Goldbet888 community tip.”
Pro Tip: Set a weekly calendar reminder for your dashboard review. Bettors who review performance on a fixed schedule adjust their strategies faster and avoid repeating the same losing patterns week after week.
Key Takeaways
A betting dashboard is the most direct path from reactive, gut-driven wagering to a disciplined, data-validated betting strategy that protects your bankroll and identifies real edges.
| Point | Details |
|---|---|
| Core definition | A betting dashboard aggregates real-time wager data, bankroll status, and performance metrics in one view. |
| Focus on 3–5 metrics | Track ROI, CLV, and yield first. Win rate alone is misleading without bankroll context. |
| Use both sync and manual tagging | Automatic syncing saves time, but manual tags reveal which strategies and leagues are actually profitable. |
| Start with the overview panel | Beginners should master balance, open bets, and transaction history before exploring advanced analytics. |
| Schedule weekly reviews | Data-validated weekly reviews prevent emotional decisions and confirm whether a strategy is working or just running on variance. |
My take on what dashboards actually change
I have watched bettors with sharp instincts consistently underperform because they had no system for reviewing their own decisions. The dashboard did not make them smarter. It made their blind spots visible.
The shift from spreadsheet to dashboard is not about technology. It is about accountability. When you can filter your entire betting history by league and see a clear negative ROI on a market you thought you were good at, the data overrides the ego. That is uncomfortable the first time. It is also the most useful thing that can happen to your bankroll.
The bettors who get the most from dashboards are not the ones with the most sophisticated setups. They are the ones who input data consistently, tag every bet, and actually sit down once a week to read what the numbers say. Discipline in data entry translates directly into discipline at the point of placing a bet.
One thing most guides skip: the dashboard review session is also where you catch emotional betting patterns. A cluster of impulsive bets placed after a big loss shows up clearly in the timestamp data. Seeing that pattern once is usually enough to stop it.
— Jaye
Goldbet888 puts live odds next to your data
Tracking your bets is only half the equation. The other half is having access to sharp, real-time odds when you are ready to act on what your dashboard is telling you.

Goldbet888 gives Singapore football bettors live odds and markets built for the kind of informed wagering that dashboard users practice. Asian Handicap and Over/Under markets are available with odds that Goldbet888 reports as consistently sharper than the market average. Withdrawals are processed in as little as three minutes, so your bankroll stays liquid between decisions. The platform’s community of 5,000+ Telegram members also shares match previews and tips that pair directly with your dashboard’s performance data. For FIFA World Cup 2026 coverage, the World Cup 2026 betting guide covers top teams, odds, and tips tailored for Singapore bettors.
FAQ
What does a betting dashboard do?
A betting dashboard aggregates your wagers, bankroll, and performance metrics like ROI and CLV in real time. It replaces manual spreadsheets and reveals patterns in your betting behavior that gut feeling cannot detect.
What is the most important metric to track on a betting dashboard?
CLV and ROI are the most reliable indicators of long-term profitability. Win rate alone is misleading because it can look strong while poor staking decisions erode your bankroll.
How long does it take to sync a sportsbook with a dashboard?
Automatic syncing typically takes under 2 minutes to authorize. After setup, your bet history and open wagers update in real time without any manual input.
Can beginners use a betting dashboard effectively?
Yes. Beginners should start with the overview panel, which shows balance, open bets, and transaction history, and add complexity only after building a baseline of clean, tagged data over the first few weeks.
Do I need to pay for a betting dashboard?
Free tiers cover basic bet logging and bankroll tracking. Advanced features like CLV analysis, AI trend tools, and multi-sportsbook syncing are available on paid plans, which typically start around $18–$25 per month.