Statistics are defined as quantitative tools that transform subjective football predictions into probability-based decisions with measurable accuracy. The role of statistics in match tips is not to guarantee outcomes. It is to shift your edge from guesswork to informed probability. Metrics like Expected Goals (xG) and Expected Goal Difference (xGD) give bettors a structured way to evaluate team quality beyond raw scorelines. Goldbet888 integrates these statistical insights directly into its match previews, helping football bettors in Singapore make smarter, data-backed decisions before placing any wager.
Which key statistics most reliably predict football match outcomes?
Seven core metrics show consistent predictive correlation for football matches: xG per 90, shot conversion rate, clean sheet percentage, aerial win rate, pass completion in the final third, xG against, and away form percentage. These metrics measure actual quality of play rather than surface-level activity. They tell you whether a team earns its results or simply gets lucky.
Possession percentage and total passes, by contrast, correlate less than 8% with match outcomes. That number is striking. A team can dominate possession and still lose badly if it generates no quality chances. Bettors who anchor their analysis on possession are building tips on a foundation that the data does not support.

Rolling windows matter as much as the metrics themselves. Analyzing xGD across 8–10 match windows gives you the most reliable single-number predictor of future league position, combining offensive and defensive quality in one figure. Data older than six matches loses predictive value quickly, so recency is not a preference. It is a requirement.
Pro Tip: Avoid “vanity stats” like total shots and possession when building match tips. Focus your analysis on xG per 90 and xGD over recent matches. These two metrics alone will outperform most casual prediction frameworks.
| Metric | Predictive value |
|---|---|
| xGD over 8–10 matches | Very high: best single predictor of future results |
| xG per 90 | High: measures offensive quality independent of luck |
| Clean sheet percentage | High: reliable defensive quality indicator |
| Possession percentage | Very low: less than 8% correlation with outcomes |
| Total passes | Very low: reflects style, not result quality |
How do statistical models outperform intuition and media narratives?
Statistical models outperform casual intuition-based predictions in 68% of football match cases over a full season. That figure comes from evaluating xG across large match samples, where models consistently see beyond short-term finishing variance. Gut feelings cannot do that. They are anchored to the last result you remember, not the underlying quality trend.
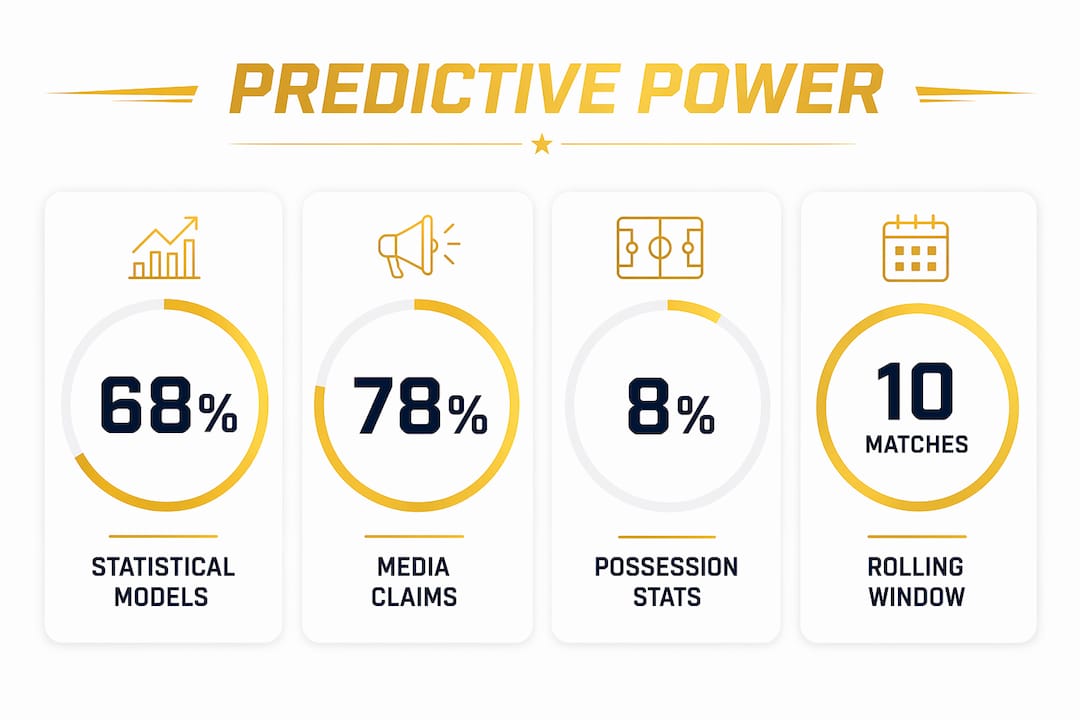
Media narratives compound the problem. 78% of pre-match media claims lack statistical basis, and bettors who rely on media are 3.5 times more likely to make emotion-driven bets than those using data-backed models. That is not a small gap. It is the difference between disciplined analysis and reactive wagering.
Professional models do not promise certainty. They maintain confidence scores between 70–88%, which means they frame every prediction as a probability estimate. That framing matters because it keeps you focused on expected value over time rather than chasing individual results.
The advantages of statistical analysis over intuition are clear:
- Removes recency bias: Models weight recent form correctly rather than overreacting to one big win or loss.
- Filters media noise: Data ignores narrative and focuses on measurable performance.
- Identifies value bets: When implied probability diverges from market odds, data highlights the edge rather than hiding it.
- Supports consistency: A repeatable analytical process produces more consistent results than variable gut instincts.
- Reduces emotional errors: Structured frameworks prevent panic betting after a losing run.
For a practical framework on applying these principles, the 2026 high-stakes betting guide on Goldbet888 walks through how to use these models in real match contexts.
What common mistakes do bettors make when applying statistics?
Data overload is the most common trap. Most bettors mistake quantity of data for quality, pulling in dozens of metrics without a clear hierarchy. The result is noise, not signal. Professional bettors use a strict hierarchy of key predictive metrics and filter out everything else.
Confirmation bias is equally damaging. Bettors often search for statistics that support a decision they have already made emotionally. That process feels analytical but produces the same outcome as pure intuition. The fix is to build your analysis before forming a conclusion, not after.
Five mistakes bettors make most often:
- Using data older than six matches. Data beyond that window loses predictive value and introduces outdated team quality signals.
- Ignoring squad rotation and injuries. Even the best xG model breaks down when key players are absent.
- Relying on a single metric. No one stat captures full team quality. Cross-referencing xG per 90, xGD, and clean sheet percentage together produces far better results.
- Treating descriptive stats as predictive. Goals scored last season describes history. xG per 90 this season predicts the future.
- Skipping situational context. Fixture congestion, travel schedules, and cup competition fatigue all affect performance in ways raw stats cannot capture alone.
Signal hierarchy is the discipline that separates profitable bettors from recreational ones. Treating volume of data as a proxy for quality of analysis creates noise. A disciplined analytic process that prioritizes the right metrics systematically shifts expected value over time.
Pro Tip: Cross-reference at least three core metrics before finalizing a match tip. If xG per 90, xGD, and away form percentage all point in the same direction, your confidence in the tip is statistically justified.
How does league context affect statistical analysis for betting?
Treating different leagues as interchangeable is a critical error. BTTS hit rate differs by up to 17% between leagues like the Eredivisie and Serie A. A strategy calibrated for one league will produce systematically wrong tips in the other. That 17% gap translates directly into lost bets when bettors apply a one-size-fits-all approach.
Home and away dynamics also vary by league. In some competitions, home advantage is a strong statistical factor. In others, top away teams with strong xG profiles create the best betting value because markets consistently underprice their chances. Identifying those mismatches requires league-specific data, not generic assumptions.
Schedule pressure adds another layer. Teams in European competition mid-week often rotate squads for domestic fixtures. That rotation changes the xG profile of the match significantly. A bettor who ignores fixture congestion is applying clean data to a messy real-world situation.
| League | BTTS rate | Avg goals per game | Away win rate |
|---|---|---|---|
| Eredivisie | High | High | Moderate |
| Serie A | Lower | Lower | Lower |
| Premier League | Moderate | Moderate | Moderate |
| Bundesliga | High | High | Moderate to high |
Adapting your statistical filters to each league is not optional. Leagues differ significantly in scoring and betting trends, and success requires adjusting your metrics and thresholds accordingly. For bettors looking to spread risk across competitions, the guide on diversifying World Cup wagers covers how to apply league-adjusted thinking to major tournament betting.
Key Takeaways
Statistics improve match tip accuracy by replacing emotional guesses with probability-based frameworks built on metrics like xG per 90, xGD, and league-adjusted form data.
| Point | Details |
|---|---|
| Use seven core metrics | xG per 90, xGD, clean sheet %, and away form % are the most predictive stats for football betting. |
| Avoid vanity stats | Possession and total passes correlate less than 8% with outcomes and distort your analysis. |
| Apply rolling windows | Analyze data across 8–10 recent matches; data older than six matches loses predictive value. |
| Adjust for league context | BTTS rates and scoring trends vary by up to 17% between leagues, requiring tailored strategies. |
| Prioritize signal over volume | A strict metric hierarchy outperforms data overload and reduces confirmation bias. |
Why I think most bettors misuse statistics entirely
Most bettors treat statistics as a confidence booster rather than a decision tool. They find a stat that supports what they already believe and call it analysis. That is not how statistical data improves decisions. It improves decisions when you let the data lead and follow where it points, even when it contradicts your instinct.
The bettors I have seen succeed long-term share one habit: they track every bet, record the reasoning behind it, and review whether the statistical basis held up. That feedback loop is where real learning happens. Without it, you repeat the same errors with more confidence each time.
Statistics do not predict outcomes. They inform probability. The moment you treat a 78% confidence score as a near-certainty, you have already made a mistake. Treat every tip as a probability bet, manage your bankroll accordingly, and let the edge compound over hundreds of decisions rather than chasing it in one match.
The discipline is unglamorous. But it is the only approach that produces sustainable results over a full season.
— Jaye
Goldbet888 brings statistical insights to your betting decisions
Goldbet888 builds statistical analysis directly into its match previews and betting markets, so you are not starting from scratch every time you place a bet.

The platform’s live odds and football markets reflect real-time data, giving you a live view of where the market stands against your own statistical assessment. Goldbet888’s match previews incorporate key metrics like xG and form data, so the analytical groundwork is already done. The platform’s Telegram community of 5,000+ members also shares match insights and previews daily, adding a collaborative layer to your data-driven process. For bettors in Singapore focused on the FIFA World Cup 2026, Goldbet888 offers specialized World Cup betting tips backed by statistical context. Better data leads to better decisions, and Goldbet888 puts that data where you need it.
FAQ
What is the role of statistics in match tips?
Statistics define the role of match tips by converting raw performance data into probability estimates. They identify value bets where market odds diverge from actual team quality, measured through metrics like xG and xGD.
Which single statistic best predicts football match outcomes?
Expected Goal Difference (xGD) over 8–10 matches is the most reliable single predictor of future results, combining offensive and defensive quality into one figure.
Can statistics guarantee a correct match prediction?
Statistics do not guarantee outcomes. They improve decision quality over time by focusing analysis on probabilities and reducing emotion-driven errors, with professional models maintaining confidence scores between 70–88%.
Why should bettors avoid possession stats in their analysis?
Possession correlates less than 8% with match outcomes, making it a descriptive stat rather than a predictive one. Bettors who rely on it risk building tips on data that does not reflect result quality.
How does league context change statistical analysis for betting?
BTTS rates and scoring trends differ by up to 17% between leagues, so applying the same statistical thresholds across competitions produces systematic errors. Each league requires its own calibrated filters and benchmarks.